
Teams using Next.js and Vercel have an advantage
Short Dev Loop & excellent automation give teams using Next.js and Vercel an advantage over teams who don't.
The microservice architecture pattern solves many of the problems inherent with monolithic applications. But microservices also bring challenges of their own, one of which is figuring out what went wrong when something breaks. There are at least 3 related challenges here:
Log and metric collection is fairly straightforward (we'll cover these in a separate post), but only gets you so far.
Let's say your 20 microservice application starts behaving badly - you start getting timeouts on a particular API and want to find out why. The first place you look may be your centralized metrics service. This will likely confirm to you that you have a problem, as hopefully you have one or more metrics that are now showing out-of-band numbers.
But what if the issue only affects part of your user population, or worse, a single (but important) customer? In these cases your metrics - assuming you have the right ones in the first place - probably won't tell you much.
In cases like these, where you have minimal or no guidance from your configured metrics, you start trying to figure out where the problem may be. You know your system architecture, and you're pretty sure you've narrowed the issue down to three or four of your services.
So what's next? Well, you've got your centrally aggregated service logs, right? So you open up three or four windows and try to find an example of a request that fails, and trace it through to the other 2-3 services in the mix. Of course, if your problem only manifests in production then you'll be sifting through a large number of logs.
How good are you logs anyway? You're in prod, so you've probably disabled debug logs, but even if you hadn't, logs usually only get you so far. After some digging, you might be able to narrow things down to a function or two, but you're likely not logging all the information you need to proceed from there. Time to start sifting through code...
But maybe there's a better way.
Distributed Tracing is a method of tracking a request as it traverses multiple services. Let's say you have a simple e-commerce app, which looks a little like this (simplified for clarity):
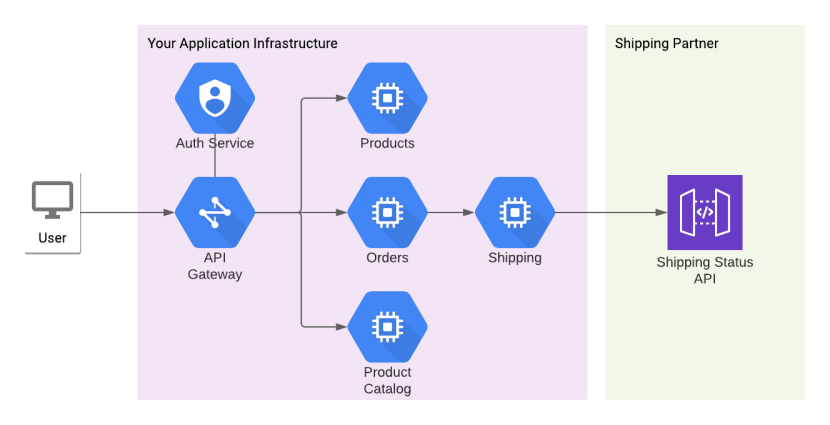
Now, your user has made an order and wants to track the order's status. In order for this to happen the user makes a request that hits your API Gateway, which needs to authenticate the request and then send it on to your Orders service. This fetches Order details, then consults your Shipping service to discover shipping status, which in turn calls an external API belonging to your shipping partner.
There are quite a few things that can go wrong here. Your Auth service could be down, your Orders service could be unable to reach its database, your Shipping service could be unable to access the external API, and so on. All you know, though, is that your customer is complaining that they can't access their Order details and they're getting aggravated.
We can solve this by tracing a request as it traverses your architecture, with each step surfacing details about what is going on and what (if anything) went wrong. We can then use the Jaeger UI to visualize the trace as it happened, allowing us to debug problems as well as identify bottlenecks.
To demonstrate how this works I've created a distributed tracing example app on Github. The repo is pretty basic, containing a packages directory that contains 4 extremely simple apps: gateway, auth, orders and shipping, corresponding to 4 of the services in our service architecture diagram.
The easiest way to play with this yourself is to simply clone the repo and start the services using docker-compose:
This will spin up 5 docker containers - one for each of our 4 services plus Jaeger. Now go to http://localhost:5000/orders/12345 and hit refresh a few times. I've set the services up to sometimes work and sometimes cause errors - there's a 20% chance that the auth app will return an error and a 30% chance that the simulated call to the external shipping service API will fail.
After refreshing http://localhost:5000/orders/12345 a few times, open up the Jaeger UI at http://localhost:16686/search and you'll see something like this:
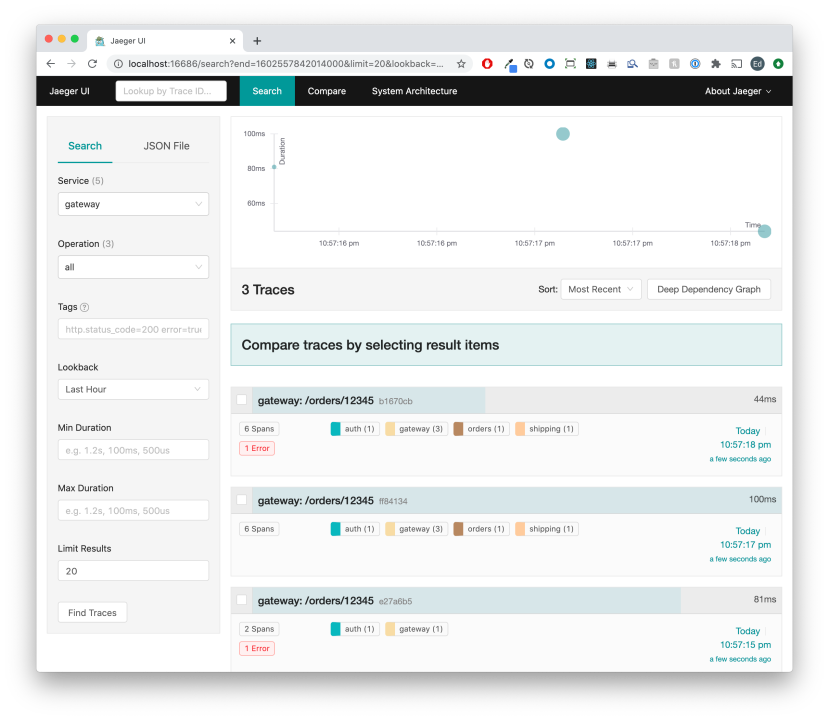
http://localhost:5000/orders/12345 serves up the Gateway service, which is a pretty simple one-file express app that will call the Auth service on every request, then make calls to the Orders service. The Orders service in turn calls the Shipping service, which makes a simulated call to the external shipping API.
Clicking into one of the traces will show you something like this:
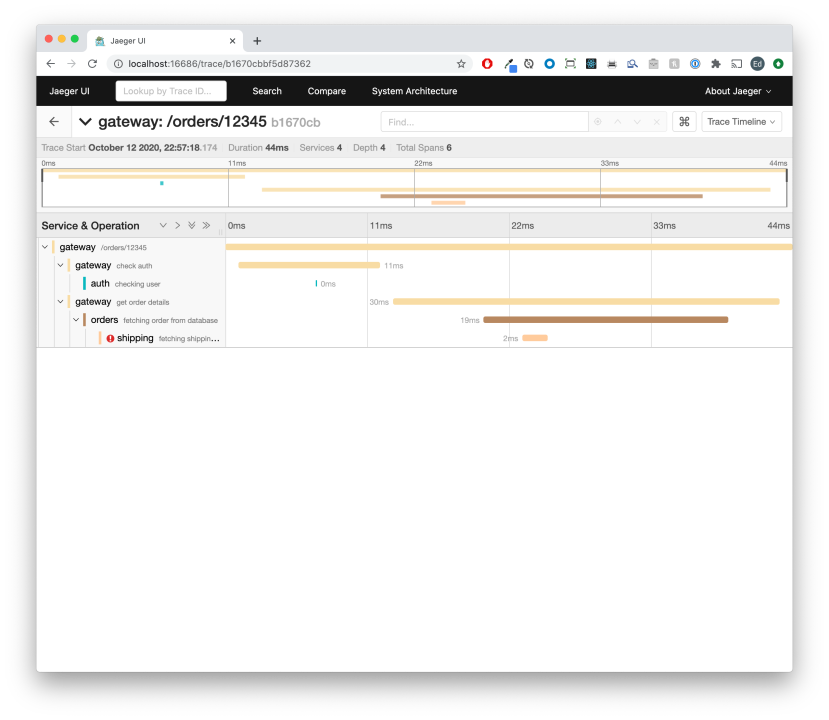
This view shows you the the request took 44ms to complete, and has a nice breakdown of where that time was spent. The services are color coded automatically so you can see at a glance how the 44ms was distributed across them. In this case we can see that there was an error in the shipping service. Clicking into the row with the error yields additional information useful for debugging:
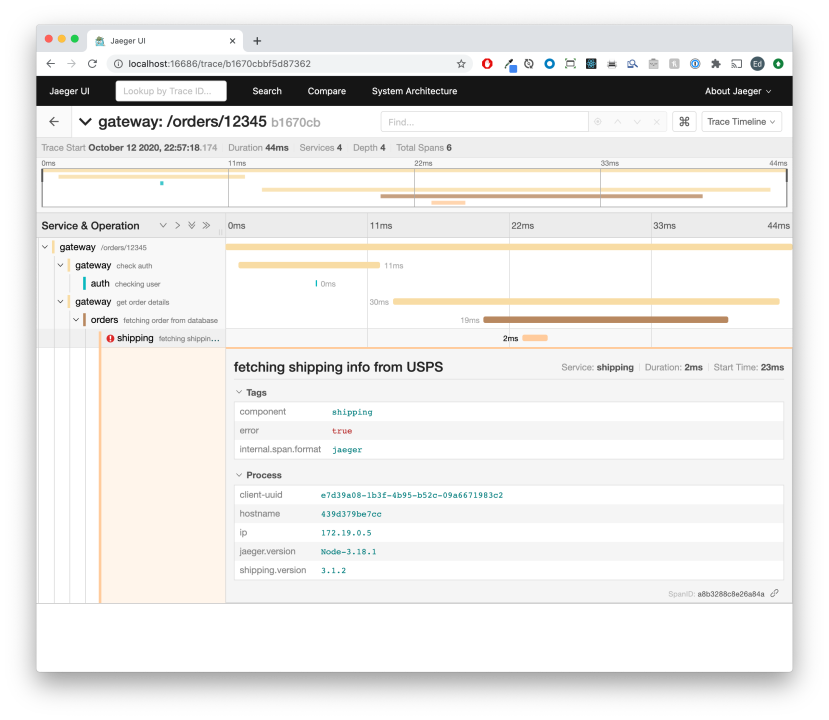
The contents of this row are highly customizable. It's easy to tag the request with whatever information you like. So let's see how this works.
Let's look at the Gateway service. First we set up the Jaeger integration:
The most interesting stuff here is where we declare our config. Here we're telling the Jaeger client tracer to post its traces to http://jaeger:14268/api/traces (this is set up in our docker-compose file), and to sample all requests - as specified in the sampler config. In production, you won't want to sample every request - one in a thousand is probably enough - so you can switch to type: 'probabilistic' and param: 0.001 to achieve this.
Now that we have our tracer, let's tell Express to instrument each request that it serves:
Here we're setting up our outer span and giving it a title matching the request url. We encounter 3 of the 4 simple concepts we need to understand:
Now let's see how we call the Auth service, passing along the span ID:
There are 2 important things happening here:
We're also showing how to add tags to a span via setTag. In this case we're appending the HTTP status code that we return to the client.
Let's examine the final piece of the Gateway service - the actual proxying to the Orders service:
This looks pretty similar to what we just did for the Auth service - we're creating a new span that represents the call to the Orders service, setting its parent to our outer span, and injecting it into the superagent call we make to Orders. Pretty simple stuff.
Finally, let's look at the other side of this - how to pick up the trace in another service - in this case the Auth service:
Here we see the 4th and final concept involved in distributed tracing:
This is how the trace is able to traverse our services - in service A we create a span and inject it into calls to service B. Service B picks it up and creates a new span with the extracted span as its parent. We can then pass this span ID on to service C.
Jaeger is even nice enough to automatically create a system architecture diagram for you:
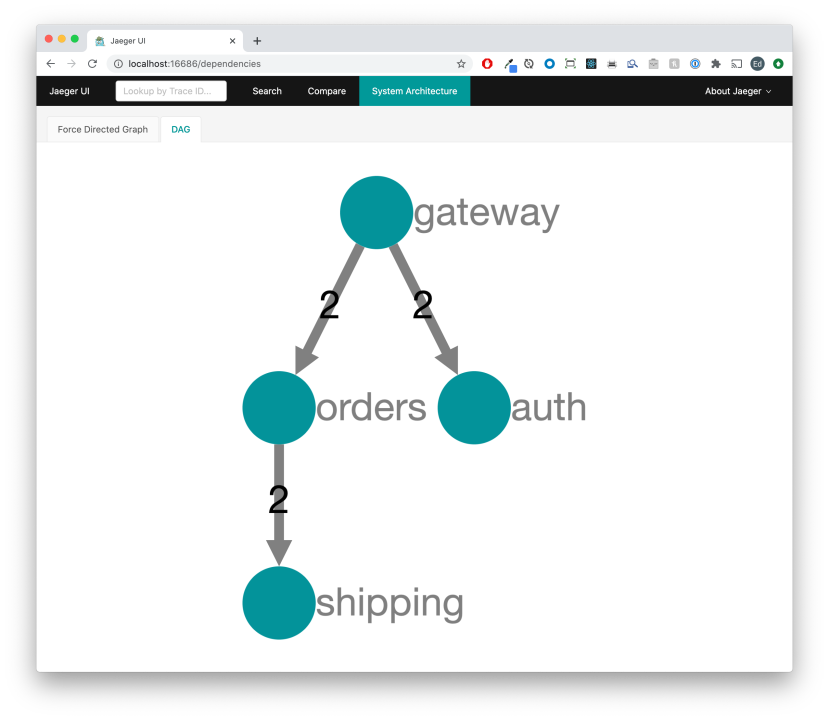
Distributed tracing is immensely powerful when it comes to understanding why distributed systems behave the way they do. There is a lot more to distributed tracing than we covered above, but at its core it really comes down to those 4 key concepts: starting spans, finishing them, injecting them into downstream requests and extracting them from the upstream.
One nice attribute of open tracing standards is that they work across technologies. In this example we saw how to hook up 4 Node JS microservices with it, but there's nothing special about Node JS here - this stuff is well supported in other languages like Go and can be added pretty much anywhere - it's just basic UDP and (usually) HTTP.
For further reading I recommend you check out the Jaeger intro docs, as well as the architecture. The Node JS Jaeger client repo is a good place to poke around, and has links to more resources. Actual example code for Node JS was a little hard to come by, which is why I wrote this post. I hope it helps you in your microservice applications.
For readers interested in further improving their JavaScript applications' performance and debugging capabilities, consider exploring Sencha Con 2013: Ext JS Performance tips for practical solutions to common performance issues. You might also find Read my BDD article in this month's JS Magazine insightful, as it delves into Behavior Driven Development (BDD) practices that can enhance application reliability and maintainability.
Short Dev Loop & excellent automation give teams using Next.js and Vercel an advantage over teams who don't.
I've been making a few updates to the ExtJS API documents application recently. The actual updates
Just as with Jacky's session, I didn't plan on making a separate post about this, but again the cont

RAG is not just for Pythonistas - it's easy and powerful with TypeScript and React too
herdctl runs Claude Code agents securely in Docker, with schedules and chat
Learn moreAI-powered work documentation for career advancement
Start free demoherdctl runs Claude Code agents securely in docker, with optional schedules and chat
→ Read moremdx-prompt lets you write reusable and composable LLM prompts using JSX
→ Read morebragdoc.ai is an open source Next JS AI SaaS app for tracking your work
→ Read morereact-auto-intl automatically internationalizes and translates React and Next JS apps
→ Read moreNarratorAI creates AI-powered content like intros and search result summaries
→ Read moreInformAI allows AI to access and understand the information in your React components
→ Read moreReadNext creates AI-powered content recommendations for your blog or other content
→ Read moreI've built things on the web for 20 years, and used JavaScript before it was cool.
I've been working for myself since early 2023, going wherever my heart takes me - mostly playing with AI and UI.